Welcome to the Data Score newsletter, composed by DataChorus LLC. The newsletter is your go-to source for insights into the world of data-driven decision-making. Whether you're an insight seeker, a unique data company, a software-as-a-service provider, or an investor, this newsletter is for you. I'm Jason DeRise, a seasoned expert in the field of data-driven insights. As one of the first 10 members of UBS Evidence Lab, I was at the forefront of pioneering new ways to generate actionable insights from alternative data. Before that, I successfully built a sell-side equity research franchise based on proprietary data and non-consensus insights. After moving on from UBS Evidence Lab, I’ve remained active in the intersection of data, technology, and financial insights. Through my extensive experience as a purchaser and creator of data, I have gained a unique perspective, which I am sharing through the newsletter.
On May 3, 2023, The Data Score Newsletter published one of the more popular entries, sharing my approach to vetting data vendors, which includes eight areas of evaluation. Many of my contacts at data companies reached out to share with me that they hadn’t realized the process to assess data sources was so involved. Meanwhile, my financial market contacts who are buyers of data shared with me that the approach outlined is very similar to what they do.
Use a completed Due Diligence Questionnaire (DDQ) to understand the compliance and risk associated with a dataset.
Assess the return on investment (ROI1) by considering how many decisions can be influenced and the potential limitations of the data.
Conduct common-sense, first-principles tests to ensure the data behaves as expected and reflects known events and expected seasonality. It’s surprising how often these types of tests are failed.
Perform back-testing against benchmarks to measure the dataset's correlation with a known KPI2 while avoiding common statistical mistakes that lead to incorrect conclusions.
Assess the transparency of the methodology used for harvesting, cleansing, and enriching the data while respecting proprietary trade secrets.
Evaluate how the data vendor handles feedback and whether they have the capacity for custom work, understanding the potential implications for competitive advantage.
Understand the vendor's competitive set by asking about their closest competitors and their target customer base.
Examine the Service Level Agreement (SLA) for post-delivery service, including response times for errors, communication of code-breaking changes, and availability of sales engineering support.
In this entry of the Data Score Newsletter, let’s dig into one of the eight points of evaluation: Assess the return on investment (ROI) by considering how many decisions can be influenced and the potential limitations of the data.
Understand the cost of the data investment
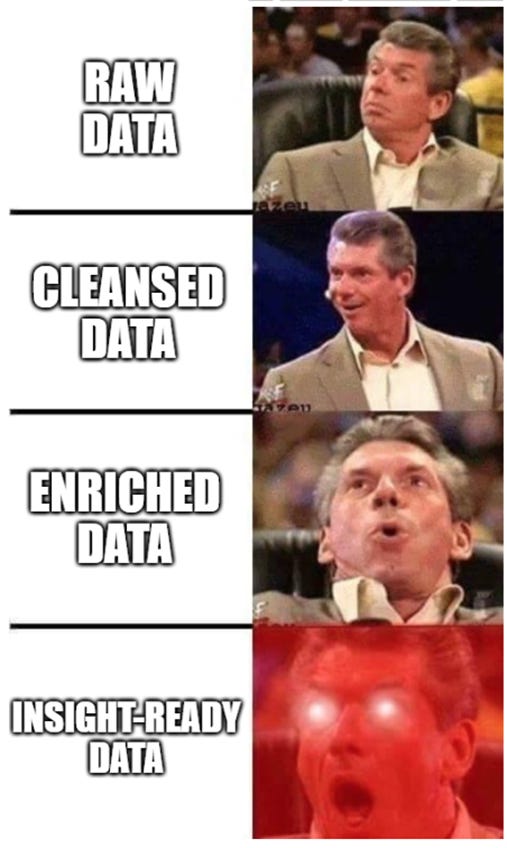
Raw data is a cost; insights have value. The conversion of raw data to insight-ready data is where investments must be made to generate value. The breadth and impact of the data-driven insights create a return on data investment.
Raw data is an input cost
Raw data on its own has no value. There is still a lingering expectation among professionals that by simply ingesting the most data possible, the answers will easily present themselves, and the decision-makers leveraging the data will have a competitive advantage.
No one actually wants raw data when they say, “Just give me the data.” They may want granular, cleansed, enriched data that’s insight-ready, but even then, they are still looking for “the insight” they need to make an economic decision.
However, the raw data cannot, on its own, deliver valuable insights. Raw data is messy and requires transformation by cleaning and enriching the data into insight-ready metrics. The larger the volume of data ingested, the more crucial the process becomes to transform raw data into insight-ready data. Data products systematically turn raw data into trusted insights that drive economic outcomes.
Cost of sourcing the data, extracting, loading and transforming data
There’s a saying that there is “no such thing as a free lunch.” Let’s also add that there is no such thing as free data. Data, even when labeled as 'free,' incurs hidden costs. Even publicly available data meant for “free consumption” costs time and effort to 1) extract the data, 2) load it into the environment where raw data is stored, and 3) transform the data into insight-ready data.
Data products can alleviate the complexity of the ELT3 (Extract, Load, Transform) process by managing it more efficiently and accurately than individual users. Appropriately assessing a build versus buy decision considers the actual costs of building a dataset.
Ease of integrating the data
When using a data provider, it’s important to consider how much of the ETL4/ELT process is being handled by the vendor versus how much is needed to be done by the data buyer. Examples of valuable table stakes features that are missed too often:
Easily joinable: The data has appropriate meta data that allows it to be easily joined to other data sets, especially datasets representing the key performance indicators that matter for decision-makers.
Symbology5: In financial markets, the data needs to be joinable to the investment data related to the investable universe. Leveraging multiple security indentifiers in the data product makes it easier to join the data to an investment.
Other examples of meta data that, if set up properly, will make the datasets easily joinable include industry standard conventions on dates, geographies, entities, and metrics.
Easy to understand data schemas: How easy is it to understand what the fields in the dataset represent and how to use the data? The longer it takes to intuitively understand the data and how to combine it with other data or further transform the data, the more it costs.
Detailed support documentation: Detailed documentation is critical to any data product to make it possible to efficiently integrate the data into a decision process. There are many assumptions that are made in processing raw data into insight-ready data, covering how the data is sourced, cleansed, and enriched. The more details, the better.
Transparency on revisions and data gaps: Processing raw data into insight-ready data is not an exact science. Data is messy. Having straight-through, exception-based processing makes it possible to generate insights at scale. But even accurate data can behave in surprising ways as it is processed. This can lead to outlier events that are redacted from the data, or potentially an entire time period removed from the dataset. Perhaps the data company interprolates in those situations, which needs to be made transparent. Sometimes, timing issues may lead to preliminary and final data points, which need to be made transparent.
Point-in-time stamps6: Its important to be able to see the data “as is” and “as was” to properly assess how the insight-ready data performs relative to the insights needed to make decisions. This becomes more important as the data has restatements, interpolations7, and data gaps.
Flexible distribution via programmatic access8: From a data buyer's point of view, they want the consumption to be as easy as possible in their environment. Programmatic access could be via APIs or other programmatic distribution methods. Buyers are not all on the same platform. The more flexible the data provider is across platforms, the less it costs the buyer to integrate it.
In addition, data companies may have proprietary access to compliant data, which they make broadly available for a cost. A premium is often justified for proprietary data, provided it adds substantial value.
Insights have value
The return on investment in data is the answer to the most important questions to drive decisions that have an economic impact. Connecting the dots between the economic decision and the data is not always straight-forward.
Can the data provide insights that change the decisions of the business for the better? Know how you will measure if it’s adding value in the future, and estimate those metrics in advance based on the inclusion of the data.
On the buyside9, this could be the alpha generation10 by being able to correctly select long versus short positions.
On the sell side, this could be recommendation and estimate accuracy or the uplift in client time talking about proprietary insights.
At corporations, it could be the accuracy of forecasting appropriate inventory levels to meet demand or improving the uplift of a marketing campaign.
There are a few things to think about when forecasting the return side of the dataset:
How many decisions can be influenced?
What is the magnitude of getting those decisions right?
What are the outcomes that are addressed by the insights?
How important are the outcomes in terms of magnitude?
Answering these questions positively increases the value of the data to the purchaser. Not all datasets can positively fulfill these criteria. For instance, a niche dataset focusing on a specific KPI in a particular sector may have limited applicability for broader decision-making. However, decisions with high economic impact, even if infrequent, can significantly elevate the data's value for the purchaser.
The data product itself should reflect the business outcomes and the questions above:
Is the data a good fit for addressing those outcomes? The datasets are often a proxy for the key performance indicator or underlying behavior that is being modeled in order to make a decision. It’s rare that a dataset could be 100% the same as the target insight needed, which is especially the case when trying to think about what will happen beyond the time horizon of the data. Even when insights are needed in real-time, datasets may not align perfectly due to noise and biases inherent in data sourcing, cleansing, and enrichment processes. Understanding the caveats to the data is important to this.
How frequent and fresh is the data made available? Not all decisions are made on a daily or intra-day basis, but having the freshest data available for when a decision is made is important to decision-makers. Offering the right frequency and freshness for the buyer's decision-making is important.
How broad and deep is the coverage within the data? The broader the coverage of data across entities, geographies, and metrics, the more questions can be answered and the more decisions can be influenced. Does the data provide depth in terms of the granularity and nuance of the high-level metrics? Again, if the dataset is niche, the importance of the handful of decisions that could be made from the data can generate value.
How long is the history in the data? Is there enough history to be confident in how the data behaves relative to the real world?
The more positive answers to each of these questions, the more valuable the data is from an ROI point of view for the buyer.
Caveats need to be assessed, along with the opportunity to generate answers
What are the limitations for the data or caveats that’s reducing its potential scope? Identify potential misuse of data that could lead to misleading outcomes, such as false positives11. Understanding these risks is vital to assessing the data's limitations.
A well-understood common example of a caveat would be that credit card data panels may have biases toward certain demographics and regions of the US, which may not overlap well with the demographics of a retail business that the end user is trying to assess with the data. And furthermore, credit card data would not be so helpful for businesses where other means of payment are used at an inconsistent rate (e.g., cash at dollar stores). The smart buyers and users of this data type understand the limitations and work within them to generate accurate, trustworthy insights.
Another example is that web-mined data12 sourcing needs to have the end analysis in mind while designing the collection. For example, when collecting prices for consumer products, the robot should capture the full website on a regular, high-frequency schedule. However, this is still just a sample of the website’s product prices. The aggregated absolute values are not useful in my opinion; however, the rate of change is a high-impact insight for understanding corporate pricing strategies. Furthermore, websites typically do not provide demand data to calibrate the weight of each price observation. Therefore, the end analysis needs to consider that limitation and focus on answering questions about price movements that are not dependent on demand weightings. Once again, smart buyers of this data understand the limitations and find valuable insights within the data, but don’t overextrapolate the data to insight use cases that could generate false signals.
The ROI of data changes over time
As data is used to make economic decisions, it is important to recognize that the decisions influence the economics of others in the market. This is particularly the case in financial markets, where the investment questions need to be answered, and the prevalence of the answers drives the share price. When the answers are fully known by the market and the investment debate is answered, new debates become the marginal driver of the share price. This could mean that a dataset that was extremely valuable in a prior year may be less valuable this year while another dataset becomes much more valuable.
Taking a "zero-based budget” approach to data is a healthy way to avoid the “we did this last year, so we’ll keep doing it this year” mindset. Zero-based budgeting13 begins with the budget at $0 at the start of the process (regardless of what was spent in the past), and then each item is justified to be included. In a world of constrained resources, being able to cut budgets from low ROI data and reinvest them in high ROI data allows for the economic impact of data-driven decisions to continually improve. The hurdle for adding value keeps rising.
Keep in mind that a higher ROI could be driven by reducing the cost of the data (both purchasing costs and ELT costs), even if the return side of the equation related to the insight is lower. Increasing automation and reducing the complexity of the data product to focus on the most important aspects of the questions to be answered can improve the ROI.
In addition, like most markets, when there’s high demand and strong economics for an area of data products, new entrants and innovations in similar data products increase the competition, and because of the ability to substitute data products, the cost of the data comes down (which in turn drives the need for more efficient data pipelines from source to insight-ready data at the data providers).
A data ROI formula?
Although a specific ROI formula for data evaluation is feasible, this entry will not provide a concrete formula but rather focus on conceptual understanding. A specific approach to measuring ROI is dependent on the context of each firm and the economic decisions being made.
There is also an inherent subjective nature between the data’s ability to directly answer questions and the human-made decision influenced by the data product. Data products work best when the producers of the data products are highly aligned with the decisions being made by the users of the data products.
There’s a question of the attribution of the decision between the human and the data. From a data product owner's point of view, users of the data product should be the hero of the story. Nevertheless, there are ways to share the value of the decision with the data products by measuring feedback as well as behaviors related to the use of the data.
For the decision-making process that’s human on the loop, such as quantitative trading funds14, the alpha generated by the data is more easily defined by measuring the alpha generated by the factor in systematic trading when included or excluded from the model.
While this entry stops short of sharing an approach to formulaically measuring ROI, I’m happy to keep the conversation going via the comments if others are willing to share their approach to ROI assessment in a more formulaic way.
- Jason DeRise, CFA
ROI (Return on Investment): a performance measure used to evaluate the efficiency or profitability of an investment or compare the efficiency of a number of different investments. ROI tries to directly measure the amount of return on a particular investment, relative to the investment’s cost. https://www.investopedia.com/terms/r/returnoninvestment.asp
Key Performance Indicators (KPIs): These are quantifiable measures used to evaluate the success of an organization, employee, etc. in meeting objectives for performance.
ELT (Extract, Load, Transform): A process for data integration Similar to ETL, but in this process, raw data is loaded directly into the data warehouse. The transformation step happens later, whenever the data is needed. This is a more common approach when using cloud computing, which allows for data to be saved at a lower cost as well as the flexibility to expand the size of the storage.
ETL (Extract, Transform, Load): A process for moving data from sources into a data warehouse and transforming the data before storing the transformed data on the server. This was the common approach when data was stored on physical servers, which limited the amount of data that could be saved.
Symbology-enriched entities: In the context of financial data, symbology refers to a system of symbols used to identify particular securities (like stocks or bonds). Symbology-enriched entities would mean data records include these identifying symbols as metadata.
Point in time-stamped history: This phrase refers to a dataset that provides the time data to show how data has been revised. So it includes not only the time period the data was related to but also the date when the entire data set was originally released or revised. This allows investors to use the data in back-testing models as if it were seen in real time before revisions.
Interpolations: A statistical method used to estimate unknown values by utilizing the known values in a dataset. It is often used to fill gaps in data.
Programmatic Access: Refers to the method of accessing data or software functionalities through code or automated scripts, rather than manual interaction.
Buyside: typically refers to institutional investors (Hedge funds, mutual funds, etc.) who invest large amounts of capital, and Sellside typically refers to investment banking and research firms that provide execution and advisory services (research reports, investment recommendations, and financial analyses) to institutional investors.
Alpha: A term used in finance to describe an investment strategy's ability to beat the market or generate excess returns. A simple way to think about alpha is that it’s a measure of the outperformance of a portfolio compared to a pre-defined benchmark for performance. Investopedia has a lot more detail https://www.investopedia.com/terms/a/alpha.asp
False Positive: An error in data interpretation in which a test result incorrectly indicates the presence of a condition (such as a pattern or trend) when it is not actually present.
Web-mined data: Data collected and extracted from the web. This could be from websites, social media platforms, forums, or other online sources. It is used for various purposes, including market analysis and competitive intelligence.
Zero-Based Budgeting: A budgeting method where all expenses must be justified and approved for each new period, starting from a "zero base," with no reference to past expenditures.
Quant funds: Short for "quantitative funds," also referred to as systematic Funds. Systematic refers to a quantitative (quant) approach to portfolio allocation based on advanced statistical models, and machine learning (with varying degrees of human involvement “in the loop” or “on the loop” managing the programmatic decision-making).
Systematic Fund: Systematic refers to a quantitative (quant) approach to portfolio allocation based on advanced statistical models, and machine learning (with varying degrees of human involvement “in the loop” or “on the loop” managing the programmatic decision-making).
Great post, Jason!