The Health of the US Consumer: A DataScore Interview with NielsenIQ
Interview: NielsenIQ's Eric Filipovitz, Hugh MacGillivray, Jess Macchi, and Valerie Hoffman on insights found in their e-receipt data
Welcome to the Data Score newsletter, composed by DataChorus LLC. The newsletter is your go-to source for insights into the world of data-driven decision-making. Whether you're an insight seeker, a unique data company, a software-as-a-service provider, or an investor, this newsletter is for you. I'm Jason DeRise, a seasoned expert in the field of data-driven insights. As one of the first 10 members of UBS Evidence Lab, I was at the forefront of pioneering new ways to generate actionable insights from alternative data. Before that, I successfully built a sell-side equity research franchise based on proprietary data and non-consensus insights. After moving on from UBS Evidence Lab, I’ve remained active in the intersection of data, technology, and financial insights. Through my extensive experience as a purchaser and creator of data, I have gained a unique perspective, which I am sharing through the newsletter.
This edition of the Data Score Newsletter continues our Q&A series, offering a deep dive into the compelling insights that data analytics firms provide, showcasing the impactful narratives data can unfold. This and future data provider interviews won’t be paid placements (it is made clear when the text is a sponsored ad) or act as an endorsement of one data vendor over another. Also, this is not investment research.
Sponsored Advertisement
Alternative Data Happy Hours in NYC
Please register here to express your interest in a low-key, informal happy hour networking event for alternative data industry participants, such as:
data buyers, such as asset managers
data providers
data experts/veterans
When and where: We will send a calendar invite to the email address you submit within this form. https://airtable.com/apprCJnlvYlNUELOF/shrQ00FN1Qox7uKK9
Cost: Free, but you handle your own tab.
Agenda: Nothing formal, just good old-fashioned happy hour mingling. Please don't treat this as a night of back-to-back sales pitches. We recommend getting to know some attendees and letting the conversation flow naturally.
Reach out to Jordan Hauer at jordan@amassinsights.com with any additional questions (LinkedIn: https://www.linkedin.com/in/jordanhauer/).
Interview Focus: What is the health of the US consumer as seen via e-receipt data?
The health of the US consumer was hotly debated in 2023, with positive and negative pressures simultaneously weighing on American households. We interviewed NielsenIQ on their e-receipt data to get a better understanding of the underlying health of the US consumer through the lens of their e-commerce activity.
The Data Score: The picture on the US consumer in 2024 is not clear due to a number of tailwinds and headwinds. Also, there isn’t just one average consumer in the US, with lots of different cohorts. Some consumers are likely handling the changing economic environment in stride, while others are feeling worse. Which consumer cohorts are most likely to see changes in their spending behavior in 2024 compared to 2023?
NielsenIQ (NIQ): In order to answer this question on how different consumers are responding to various economic conditions, we examined our panel of 2.8 million US e-commerce consumers based on their levels of income. Our NielsenIQ e-receipt-based panel and data consist of transactions made across the US e-commerce spectrum and are not inclusive of in-store purchases. This spans merchants from typical online or app-based classic e-retailers like Amazon or Wayfair to a mix of merchants from Tesla to Intuit. It’s important to understand that the takeaways we’ll be sharing extend beyond just retailers selling products online but also include other services and subscriptions.
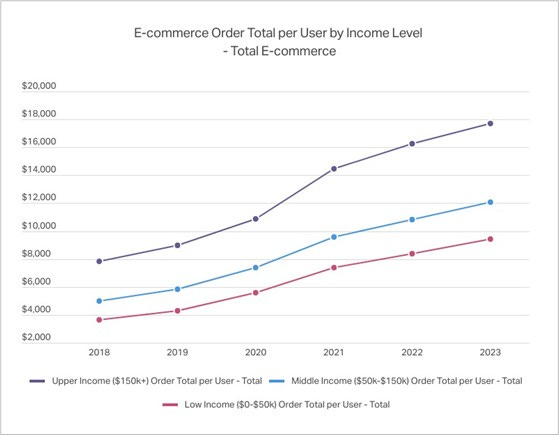
The first thing we examined was order dollar total (total spend) per user across all of our 1,300+ merchants to look at behavior across various income brackets at the highest level. The first observation is that all income brackets continue to spend more on e-commerce every year, with all three income levels more than doubling their spending from 2018 to 2023. They also moved fairly close together over this timeframe as all income brackets adopted greater e-commerce spending at similar rates. We will drill down into more specific changes below.
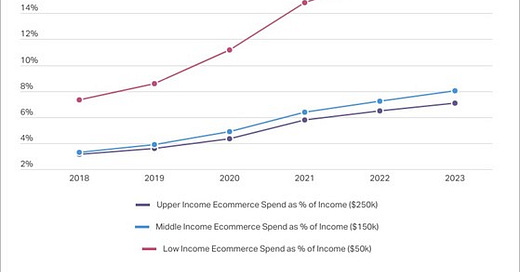
When looking at the money being spent per user relative to static total income denominators ($50k, $150k, and $250k), the percentage of total income spent on e-commerce by low-income consumers is eye-catching. In response to the original question of what to watch in 2024 versus 2023, this data point stands out as something to watch. Again, our merchant list covers a wide range of industries and services, so this is inclusive of things such as wireless phone payments and Netflix subscriptions, but the percentage has to be reaching a plateau in light of all the other expenses in a consumer's life at a low income level.
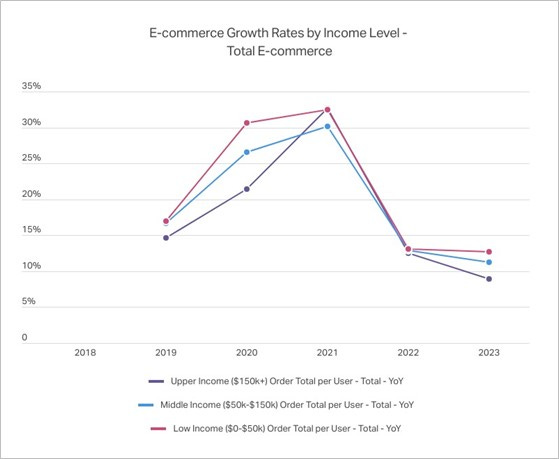
The annual growth rates across the three income levels tell an interesting story and produce a surprising result for 2023. In response to the pandemic in 2020, low- and middle-income consumers provided the largest growth rates as people relied much more heavily on e-commerce for daily needs that might have been new to them at the time (e.g., grocery delivery). 2021 and 2022 produced similar growth rates across all three groups as people returned to a more normal life. With goods and services becoming more expensive in 2023 and straining budgets of all income levels, it was surprising to see that income level growth rates diverged in 2023 and that low income had the highest growth rate and high income had the lowest growth rate. The main questions heading into 2024 are whether or not we’ll see a reversal of these growth rates as low-income consumers are the most likely to start pulling back and whether upper-income consumers can offset that with an acceleration as markets continue to climb that typically benefits upper-income consumers in an outsized way.
The Data Score: That is a surprising insight that low income cohort’s spending became an even higher share of their income. Is it possible that their overall spending is trending differently, but their e-commerce adoption is accelerating? Maybe a new normal post pandemic is that e-commerce adoption is confirmed to be firmly entrenched in the shopping habits for low income consumers?
NIQ: It was surprising that low-income spending gained share in the last handful of years. First, for some context, low income makes up the smallest group in terms of total spend share, with 19.8% of total money spent in 2023. This figure has grown from 18.4% in 2018, so it is growing, but just to put those growth figures into context,. On the flip side, middle income made up 53.0% of total spending, and upper income made up 27.2%.
With those background figures in place, it was surprising that the share has grown in the low-income group. I think there are a few things at play that are contributing. First, the low-income bucket has an outsized percentage of younger consumers who have grown up doing everything online, and they now have some money and spend more online. Basically, a larger percentage of low-income consumers are likely just out of high school or college, and that generation does more online than others. Second, to your point, when you look at older age groups that fall in the low income bucket, I think they were later adopters and are now used to that way of life, so they look to spend online first more and more frequently now that it is a part of their life. Lastly, someone looking to save some money (which many are doing as inflation has changed things in recent years) is more likely to value-shop online to find the best deals. Ultimately, there’s a good chance that strained budgets lead to more value-seeking, and your phone or computer is the easiest place to do value shopping.
The Data Score: Looking through the noise of the data in 2023 are there underlying trends that suggest the consumer health is getting better or worse?
NIQ: In an effort to look through the noise that can be present in the analysis we discussed above, we conducted the same analysis on specific companies and industries to suggest that consumer health is getting better or worse for our three income levels on specific fronts.
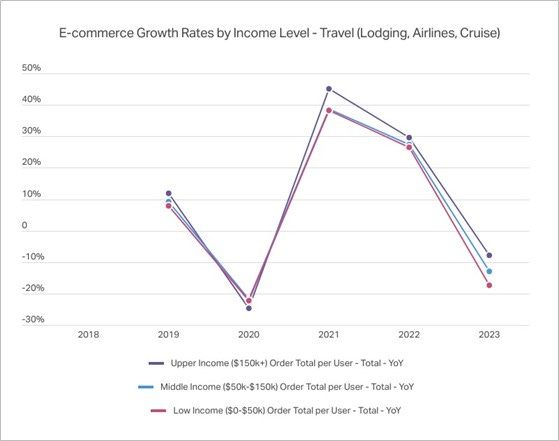
The first industry that we examined was the travel industry through a cohort of all the transactions at 17 merchants across the lodging, airline, and cruise industries (Airbnb, Booking.com, Expedia.com, Hotels.com, Vrbo, Hilton.com, Marriott.com, Southwest Airlines, Delta, American Airlines, Royal Caribbean, Carnival Cruises, etc.). The first thing that stands out is the declining growth rates in 2023 for all three groups. Upper-income consumers remain the most resilient, with the highest growth rate in 2023. Low-income consumers separated from the other two income levels in 2023 and are showing signs of weakness as we go into 2024.
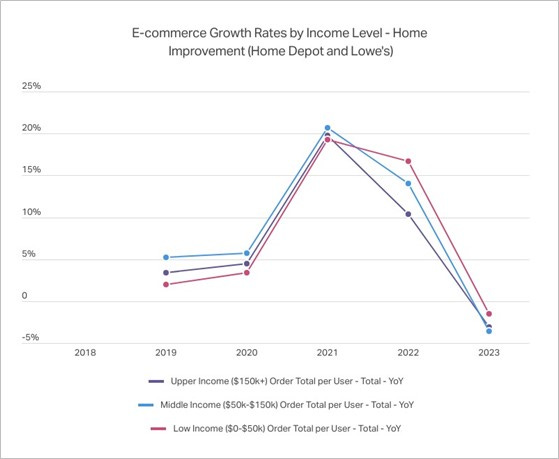
When looking at the home improvement category (Home Depot and Lowe’s), we see a similar trend in annual growth rates, as growth has slowed since 2021. What is surprising is that low-income consumers have represented the largest growth rates in both 2022 and 2023. The most vulnerable group to an inflationary environment is still spending money on home improvement when looking at it relative to middle- and upper-income consumers. To see low-income consumers pull back on travel is not surprising, but to see the opposite behavior in another big-ticket industry such as home improvement was not expected. It could be a possible indicator that low-income users have shifted their spending habits to their homes in lieu of going out to eat, attending events, or going on trips, as those have all gotten increasingly expensive.
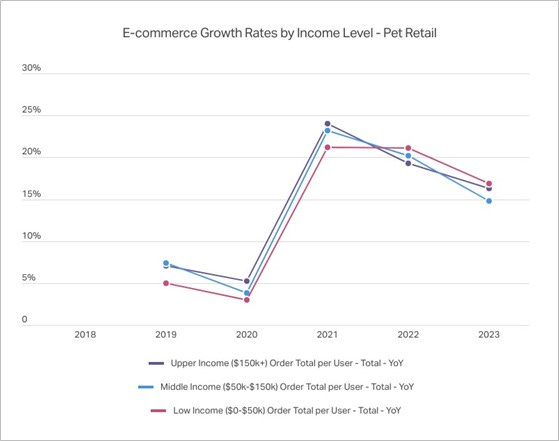
The pet industry (Chewy, Petsmart, Petco, Pet Supplies Plus, and PetMeds) showing weakness in middle-income consumers in 2023 is a possible indicator of strain on that class where it typically does not exist. Growth rates for all classes remain positive as new users of all income classes shift their spending habits on pets from in-store to online. Typically seen as a category that is fairly resilient to inflation as owners dedication to their pets typically makes them look at other categories well before considering cutting back on spending on their pets. To see the middle class have the lowest growth rate in 2023 for the first time in our analysis is an indicator that some cracks are showing in the middle class where they typically do not show up. We’ll cover more on this development during the last question when looking specifically at Chewy.
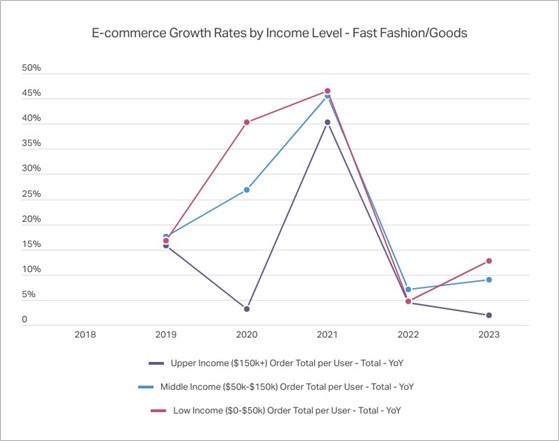
The last category we examined was the fast fashion/goods industry (Shein, Temu, Zara, and Wish.com) to see if income levels are behaving differently in this relatively new and low-cost category. After showing similar trends across all three income levels in 2021 and 2022, trends in 2023 have diverged. Low- and middle-income consumers have seen an acceleration in growth rates in 2023, while upper-income growth rates have continued to decline. This is an indicator of potential value shopping across both low- and middle-income groups that shows signs of weakness across both groups heading into 2024.
The Data Score: Which data points are you watching most closely in the coming weeks and months to assess how consumer spending is likely to change in 2024 vs 2023?
NIQ: For the third question, we drilled down into a couple of our syndicated reports on specific companies (Netflix and Chewy.com) to show some more granular data points that are worth watching in the coming weeks and months.
Netflix
Online streaming services have been steadily increasing in price in recent years, consuming a larger percentage of consumers disposable income. NielsenIQ data highlights that we may be approaching a limit on what consumers are willing to pay. With costs increasing, customers have two options for scaling back on their spending: the first is to pick and choose services they want and cancel others; the second option is to maintain subscriptions while paying less (usually by accepting fewer premium features and more recently choosing a streaming tier with ads).
Within the streaming space, Netflix is a good example to see trends and change across the industry. For a number of years now, Netflix has been nearly fully penetrated in the US market, with a diverse subscriber base spanning the economic spectrum.
Watching to see if customers maintain their Netflix subscriptions throughout 2024 will be a key indicator we watch to gauge the health of the consumer.
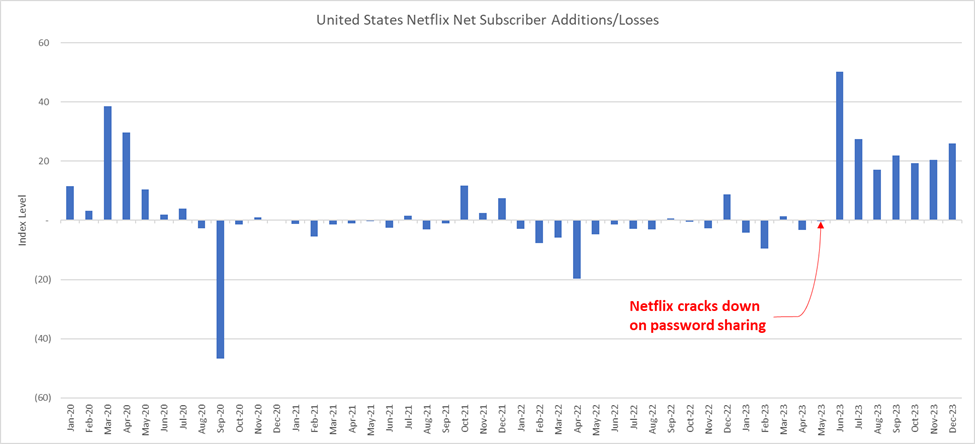
It was only recently that Netflix cracked down on password sharing, giving the company a temporary boost in subscription rates, so monitoring for when cancellations begin to net out subscriptions yet again will highlight a threshold of people's willingness to spend.
The other trend we're monitoring within Netflix is the rate at which customers switch to an ad-supported tier now that it is widely available across the industry. Over the past year, we've seen new subscribers become more than twice as likely to sign up for a Netflix plan with ads. This is a major change in the streaming space and indicates there is a significant appetite for customers across income ranges to reduce their spending on streaming services.
Chewy.com
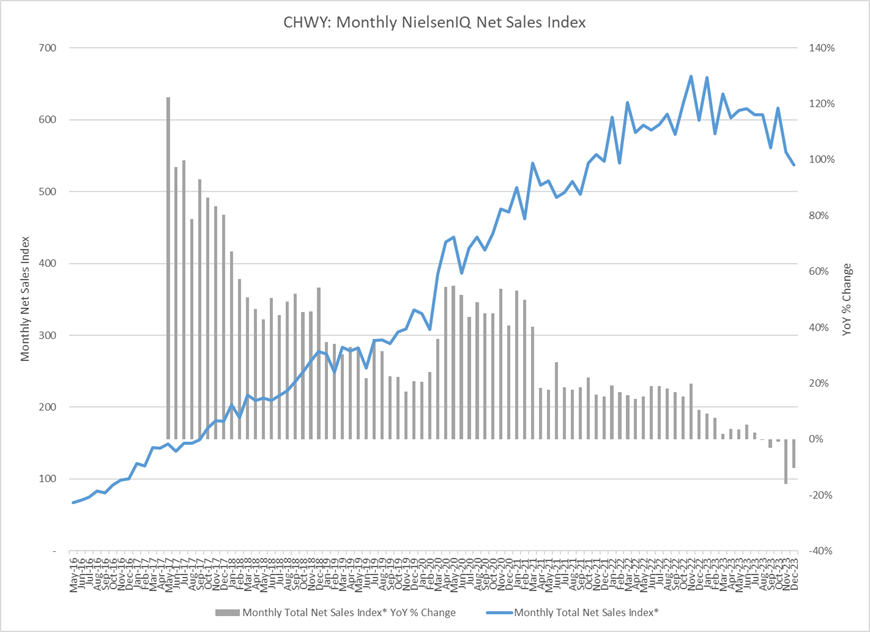
After seeing double-digit year-over-year sales growth through July 2023, NielsenIQ data shows Chewy began to see some weakness in Q4 2023 Monthly Net Sales with more value-seeking behavior from consumers. This trend is consistent across income groups, with the middle-income bracket comprising the majority of Chewy buyers.
Order volume and average basket size both shifted negative in November and December 2023, yielding a decrease in monthly net sales.
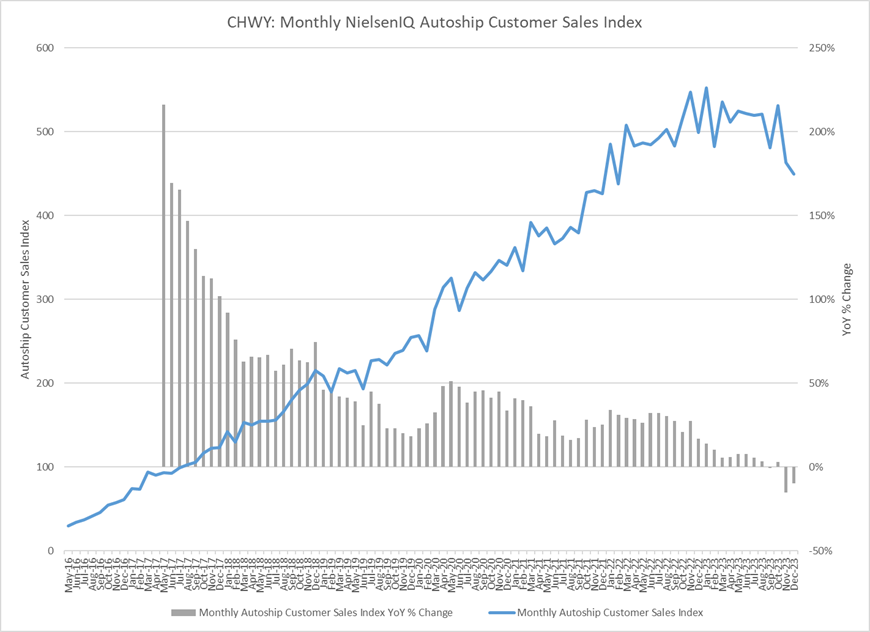
While Chewy management referenced a more discerning consumer with softening demand in Q3 2023 earnings, the company felt Autoship sales (automatically recurring orders for preferred pet supplies at a 5% price discount for consumers, representing ~76% of total Chewy sales) are more immune to these macro changes. However, data for November and December 2023 Autoship sales show a decline in year-over-year Autoship sales, driven by both a decline in order volume and AOV. Continuing to monitor this trend should provide insight into how all income levels are responding, with a particular focus on the middle-income level.
Concluding thoughts
I’d like to thank the NielsenIQ team for their time and effort to share insights based on their data. If you’d like to learn more on the data covered in this article, please reach out to NIQ analysts Eric Filipovitz (Eric.Filipovitz@nielseniq.com), Hugh MacGillivray (Hugh.MacGillivray@nielseniq.com) and Jess Macchi (Jess.Macchi@nielseniq.com).
For NIQ partnership inquiries, please reach out to Valerie Hoffman (Valerie.Hoffman@nielseniq.com),
NIQ's provides their clients with a complete and actionable understanding of the evolving, global, omnichannel consumer, revealing new pathways to growth. Learn more about NIQ’s alternative data for financial services at Alternative Data for Financial Services Companies - NIQ (nielseniq.com)
In addition to connecting with NIQ directly, feel free to leave comments and questions below the article.
For more content like this and to see future interviews, subscribe to the Data Score Newsletter.
Feel free to share the article with anyone who would find it useful.
- Jason DeRise, CFA
Update On Feb 1, 2025: Premium content is now turned on. Even though this interview is in the premium content section of “Data Driven Investing,” I plan to keep interviews as free content.

