
Avoiding Common Sense Pitfalls: How Many Alternative Data Products Fail Simple Sanity Checks
Discover the checks investors rely on and the steps vendors should take to ensure their data stands up to scrutiny.

Many alternative data vendors overlook the basic common sense checks that investors use to vet data. Ignoring these checks can undermine trust and limit adoption, regardless of backtesting1 sophistication.
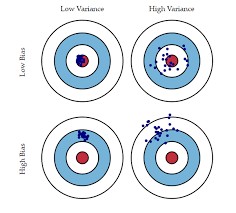
All alternative datasets have bias and variance: common sense checks help reveal where issues may hide.
Investors expect data to reflect intuitive truths and align with real-world events.
Vendor modeling can unintentionally obscure these signals.

In an earlier issue of The Data Score, I described the eight-point process the buy-side2 commonly uses to vet alternative data vendors.

Use a completed Due Diligence Questionnaire (DDQ3) to understand the compliance and risk associated with a dataset.
Assess the Return on Investment (ROI4) by considering how many decisions can be influenced and the potential limitations of the data.
Conduct common sense, first-principles tests to ensure the data behaves as expected and reflects known events and expected seasonality. It’s surprising how often these types of tests are failed.
Perform back testing against benchmarks to measure the dataset's correlation with a known KPI while avoiding common statistical mistakes that lead to incorrect conclusions.
Assess the transparency of the methodology used for harvesting, cleansing, and enriching the data, while respecting proprietary trade secrets.
Evaluate how the data vendor handles feedback and whether they have the capacity for custom work, understanding the potential implications on competitive advantage.
Understand the vendor's competitive set by asking about their closest competitors and their target customer base.
Examine the Service Level Agreement (SLA) for post-delivery service, including response times for errors, communication of code-breaking changes, and availability of sales engineering support.
Since then, I believe the industry has become more sophisticated in its understanding of this process, especially regarding data backtesting. Platforms like Maiden Century have helped advance data vendor thinking and capabilities by offering scalable tools to compare datasets on the productivity of key KPIs. Many data companies are now understanding the quant standard as discussed in this article:

However, a due diligence step remains underappreciated by data vendors selling to the buy side: common sense data checks. Investors use common sense and first-principles tests to ensure data behaves as expected and reflects known events and seasonality. It’s surprising how often vendors fail these basic tests.
This article breaks down the logic behind common sense data checks and provides practical examples to help vendors improve. It also can help the buy side benchmark their approach to industry standards.
Why investors need common sense validation, not just backtests.
How to run sanity checks on your own data before buyers do.
Where vendor data modeling and indexing go wrong.
What happens when common sense fails, and how to recover trust.
Action steps for data vendors and buyers.
Welcome to the Data Score newsletter, composed by DataChorus LLC. This newsletter is your source for insights into data-driven decision-making. Whether you're an insight seeker, a unique data company, a software-as-a-service provider, or an investor, this newsletter is for you. I'm Jason DeRise, a seasoned expert in the field of data-driven insights. I was at the forefront of pioneering new ways to generate actionable insights from alternative data. Before that, I successfully built a sell-side equity research franchise based on proprietary data and non-consensus insights. I remain active in the intersection of data, technology, and financial insights. Through my extensive experience as a purchaser and creator of data, I have a unique perspective, which I am sharing through the newsletter.
Why investors need common sense validation, not just backtests
All alternative data sets have bias and variance
Traditional data used in financial markets are typically considered facts. The price of a security, the reported financials of a company, and the valuation metrics are all considered facts. The transacted price is what is reported on the exchange; financials are the company’s audited results.
Even metrics like consensus5 EPS estimates and forward P/E ratios6, while the consensus itself may be inaccurate, are trusted as an accurate reflection of what the sell side believes. It’s trusted as a fact because the components of the sample are 100% verifiable. The consensus EPS is made up of specific verifiable individual sell-side EPS estimates. There isn’t any sampling or modeling. It’s a known, verifiable data point.
Alternative data refers to data that is not traditional or conventional in the context of the finance and investing industries. Traditional data often includes factors like share prices, a company's earnings, valuation ratios, and other widely available financial data. Alternative data can include anything from transaction and social media data to web traffic, web-mined data, satellite images, and more. This data is typically unstructured and requires more advanced data engineering and science skills to generate insights.
Alternative data uses proprietary methods to compliantly collect information on consumer and business behaviors, intentions, and sentiment. Alternative data is highly valuable to generating an edge for fundamental and quantitative analysts because the data is more granular or earlier than traditional data. The data is descriptive of underlying drivers of the KPIs that explain share price movements. These sources can provide early signals that help predict the fundamental KPIs that move markets.
Alternative data is rarely a complete view of the underlying activity being measured and is based on some form of sampling. Panels7 of transactions or panels of digital behavior, like surveys and polls, introduce variance and bias. Even when collection methods are closely tied to the underlying activity, they often rely on point-in-time observations, which may not capture changes as frequently as they occur (e.g., reverse-engineered order numbers to infer consumer order velocity or web-mined store locations). Additionally, they may not reflect the true importance of a data point—such as a web-mined product price being accurate only at the moment collected but not accounting for demand-weighted significance at the company level.
A primer on variance and bias
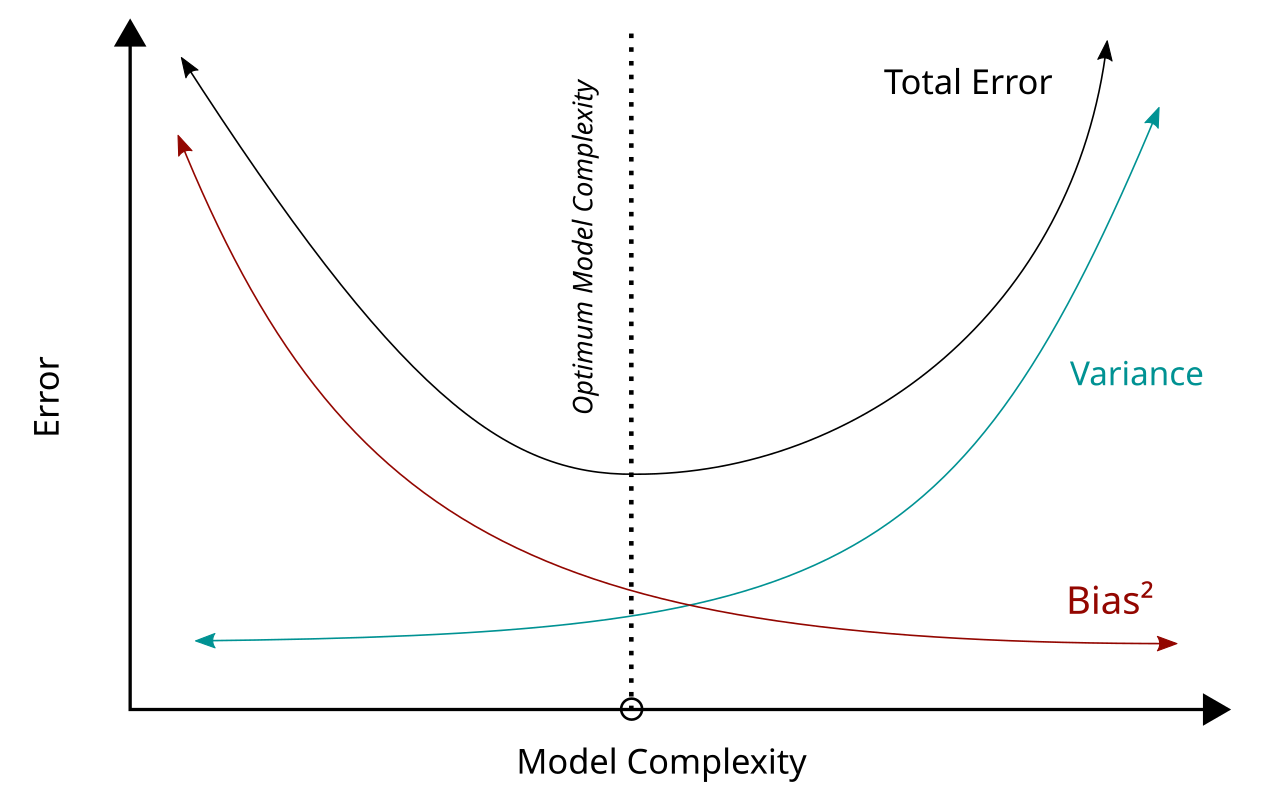
In statistics and machine learning, the bias–variance tradeoff describes the relationship between a model's complexity, the accuracy of its predictions, and how well it can make predictions on previously unseen data that were not used to train the model. In general, as the number of tunable parameters in a model increase, it becomes more flexible, and can better fit a training data set. That is, the model has lower error or lower bias. However, for more flexible models, there will tend to be greater variance to the model fit each time we take a set of samples to create a new training data set. It is said that there is greater variance in the model's estimated parameters. Wikipedia
Just because alternative data has variance and bias, it doesn’t mean it’s not valuable. Its value is in the context of the variance and bias of the markets views. Where the alternative data reduces the margin of error8 compared to the consensus despite its own underlying variance and bias, it means it will add value, especially when the alternative data is signaling a different view than what’s priced into the company’s valuation.
Investors can work around bias and variance if they are able to understand the underlying drivers of each in the dataset. The goal is to generate a model that balances bias and variance so that a model can backtest well but also perform well in real use. An overfit model will generate high variance in the real world.
A model with high bias but low variance could be fixed by adding some factors (increasing the model complexity).
A model with high variance and low bias could be resolved by reducing complexity.
The only way to truly identify the right factors is to understand the underlying data—and that’s where common sense sanity checks matter.
Why common sense checks are just as important as the statistical backtests
To trust backtests, the underlying raw data must first make logical sense.
Investors know correlation doesn’t mean causation. A key defense is being able to logically connect alternative data to real-world activities and then connect those dots to the KPIs that matter to security valuation.
Here are some well-known examples of spurious correlations
The winner of the super bowl predicts bull/bear markets
Ice cream causes shark attacks! Obviously it’s the warm summer weather that’s a driver of people’s consumption of ice cream and also the activity of swimming in the ocean.
While searching for examples to reference, I uncovered a great website.
https://tylervigen.com/ where the author shows thousands of examples of spurious correlations. An example is the correlation of rickrolling to Tesla’s share price (apparently spurious correlation #5,160 on the website).
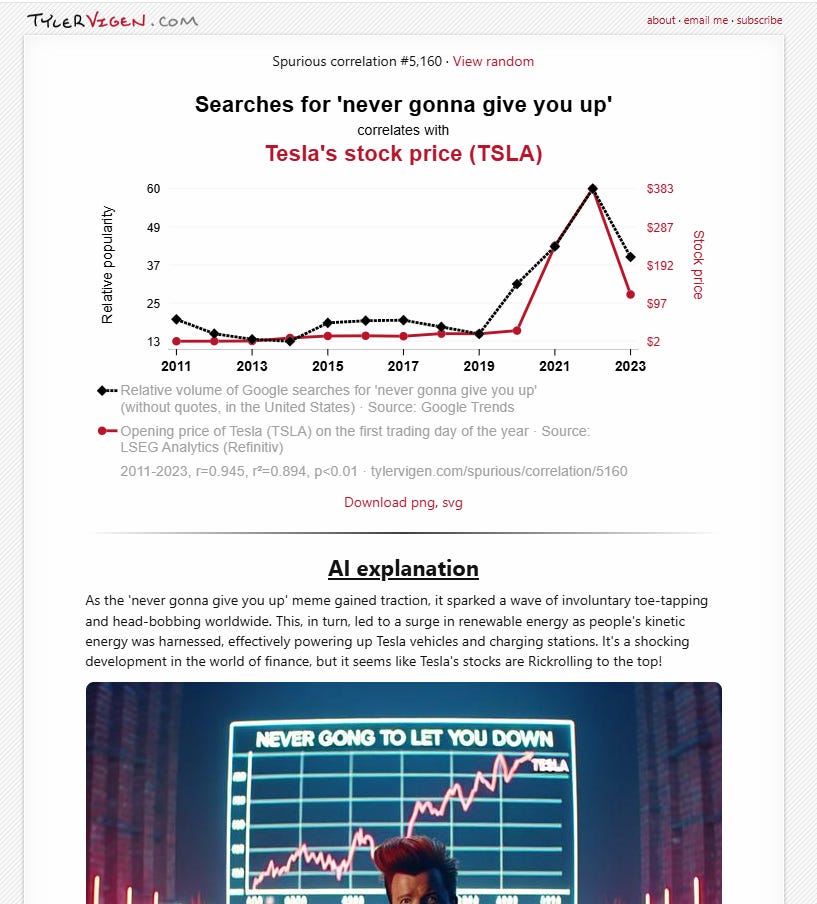

While the above examples are silly and easy to spot as spurious, there are many real-world examples where I have seen a financial professional show a correlation between two variables and a loose story as to why it makes sense. But, upon further investigation, it was obviously spurious correlation or, in technical terms, an overfit model that would fail in production.
Common sense data checks help connect the data vendor’s methodology and output logically. Well-documented consumer and business behaviors serve as ground truth, ensuring data is logically connected to reality.
A dataset that backtests well but the underlying data is hard to connect back to reality triggers red flags for investors who have been burned by the adage that correlation is not causation.