


Data Deep Dive: Google Trends, Part III
We’ve dissected Google Trends, from understanding the underlying data to cleansing and enriching it. In Part III, we dive into the metrics and analytics. Plus, an analysis for Taylor Swift fans.

Welcome to the Data Score newsletter, composed by DataChorus LLC. The newsletter is your go-to source for insights into the world of data-driven decision-making. Whether you're an insight seeker, a unique data company, a software-as-a-service provider, or an investor, this newsletter is for you. I'm Jason DeRise, a seasoned expert in the field of data-driven insights. As one of the first 10 members of UBS Evidence Lab, I was at the forefront of pioneering new ways to generate actionable insights from alternative data. Before that, I successfully built a sell-side equity research franchise based on proprietary data and non-consensus insights. After moving on from UBS Evidence Lab, I’ve remained active in the intersection of data, technology, and financial insights. Through my extensive experience as a purchaser and creator of data, I have gained a unique perspective, which I am sharing through the newsletter.
Google Trends is widely used as an alternative data1 source, yet it’s often misapplied in arguments, leading to misleading conclusions. The data itself isn’t flawed; rather, it’s the misunderstanding of the data that leads to misinterpretation and poor application.
This article concludes our three-part series on Google Trends. In parts I and II, we discussed common questions addressed with the data, explained the underlying data that is extracted from Google Trends, and explained how to cleanse the data so it is usable. In this final part, we discuss enriching the data for analytics, the limitations of the data and some action items to begin using the data.
In the Dataset Deep Dive Series, the format covers the following topics:
Common questions addressed with the data (Covered in Part I)
Underlying Data (Covered in Part I)
Cleaning the Data (Covered in Part II)
Enriching the data (Part III)
Limitations to consider (Part III)
Action items to begin using the data (Part III)
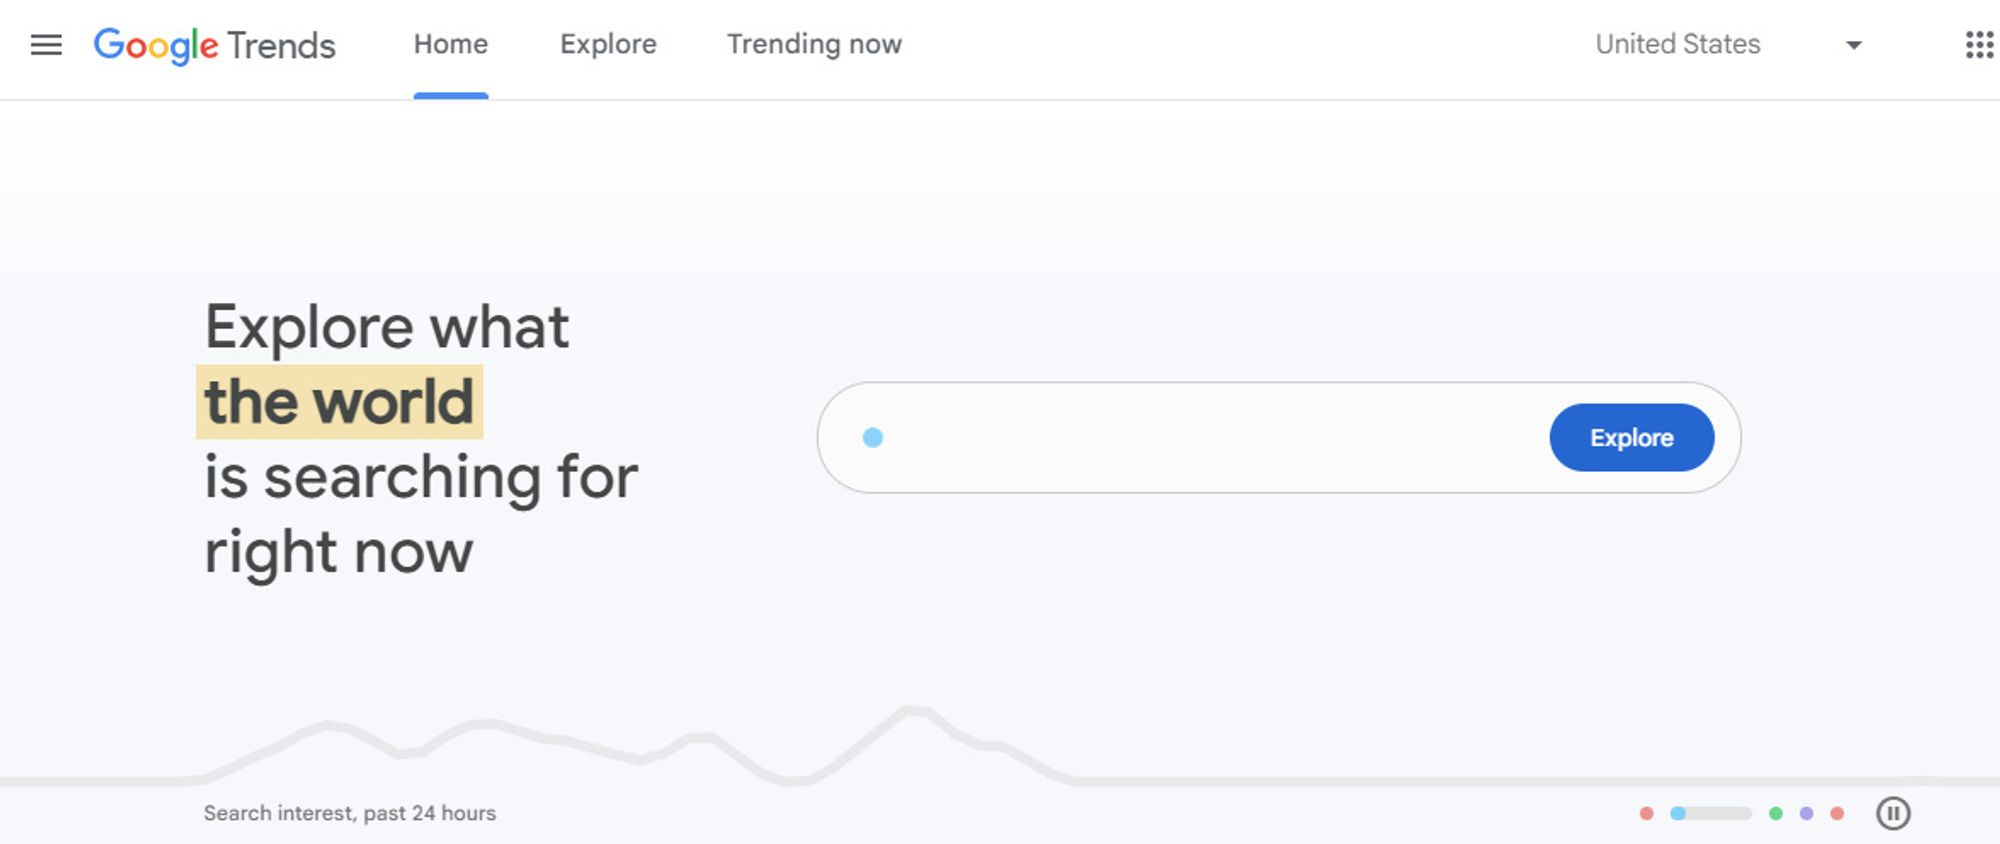
https://trends.google.com/trends/
The use case for this deep dive on Google Trends was sparked by a well-known YouTuber in the music industry who recently used Google Trends to argue that music is not as good as it used to be and that music is becoming less popular. I thought this question of the popularity of music compared to other activities provided a great low-key topic to explore via Google Trends, using the best practices for getting quality results. It also helps contrast good and poor uses of Google Trends. Check out Part I for more context.


Sponsored Advertisement
World of DaaS in DC
Thursday, August 29th 2024, 6-8PM
Join DC's leading data executives, investors and self-proclaimed "data nerds" for an evening of drinks, networking and new ideas!

Some people you can expect to see:
Sara Fagen, Founder & CEO, Tunnl
Jason Hines - CEO & Co-founder, Gigasheet
Auren Hoffman - CEO, SafeGraph. Fmr CEO, LiveRamp (NYSE: RAMP)
Michael Southworth - CEO, Babel Street
Register: https://daasindc.rsvpify.com/?securityToken=UphNFxe8R6K2Jt18lJffjslyMo74zHrb
Enriching the data
In this section, we’ll explore how to transform cleansed data into actionable metrics that align closely with the specific use case.
In Part I, we discussed the investment questions that can be answered with Google Trends data in the context of what the underlying data represents.