Follow-up on Fashion Industry Pricing Trends: A Data Score Interview with Flywheel
A check-in with Flywheel Digital's James Griffiths and Nick Katzaroff on the fashion industry's 4Q 23FY pricing trends,focusing on clearance activity.
Welcome to the Data Score newsletter, composed by DataChorus LLC. The newsletter is your go-to source for insights into the world of data-driven decision-making. Whether you're an insight seeker, a unique data company, a software-as-a-service provider, or an investor, this newsletter is for you. I'm Jason DeRise, a seasoned expert in the field of data-driven insights. As one of the first 10 members of UBS Evidence Lab, I was at the forefront of pioneering new ways to generate actionable insights from alternative data. Before that, I successfully built a sell-side equity research franchise based on proprietary data and non-consensus insights. After moving on from UBS Evidence Lab, I’ve remained active in the intersection of data, technology, and financial insights. Through my extensive experience as a purchaser and creator of data, I have gained a unique perspective, which I am sharing through the newsletter.
This edition of the Data Score Newsletter continues our Q&A series, offering a deep dive into the compelling insights that data analytics firms provide, showcasing the impactful narratives data can unfold. This and future data provider interviews won’t be paid placements (it is made clear when the text is a sponsored ad) or act as an endorsement of one data vendor over another. Also, this is not investment research.
Interview Focus: How did the fashion industry perform in January's seasonal clearance activity?
On December 11th, James Griffiths and Nick Katzaroff from Flywheel Digital provided insights on the performance of fashion companies during the holiday selling season, post-Black Friday, and Cyber Monday.
This interview follows up to assess the performance of fashion retailers for the remainder of the selling season, focusing on January's clearance activities post-holiday season. The clearance month allows fashion retailers to prepare for the upcoming season by discounting prices to clear out existing inventory. This is when the reality of the entire selling season is visible through web mining pricing analytics.
Flywheel tracks the list price and discounted price on the product display page of each individual retailer’s website each day. Please note that they do not capture coupon codes or sitewide discounts that only apply at checkout. Access Flywheel Alternative Data’s latest research here: https://www.linkedin.com/company/flywheel-alternative-data/
Sponsored Advertisement
Alternative Data Happy Hours in NYC
Please register here to express your interest in a low-key, informal happy hour networking event for alternative data industry participants, such as:
data buyers, such as asset managers
data providers
data experts/veterans
When and where: We will send a calendar invite to the email address you submit within this form. https://airtable.com/apprCJnlvYlNUELOF/shrQ00FN1Qox7uKK9
Cost: Free, but you handle your own tab.
Agenda: Nothing formal, just good old-fashioned happy hour mingling. Please don't treat this as a night of back-to-back sales pitches. We recommend getting to know some attendees and letting the conversation flow naturally.
Reach out to Jordan Hauer at jordan@amassinsights.com with any additional questions (LinkedIn: https://www.linkedin.com/in/jordanhauer/).
The Interview
The Data Score: How does the intensity of promotional activity in January 2024 compare to that of previous years?
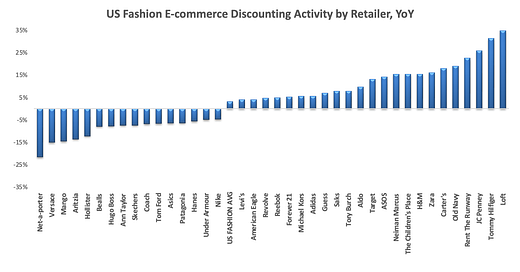
James Griffiths and Nick Katzaroff from Flywheel Digital: The US fashion industry promoted more aggressively in January compared to 2023. Looking at the weighted average of a sample of US fashion retailers using Flywheel E-commerce pricing and promotion data, discounting activity1 in US fashion e-commerce for the trailing 28-day period ending January 28th increased by 3.2% compared to the previous year. This increase was attributed to a 4% rise in the percentage of discounted products, with 46% of tracked products being discounted, and a 0.7% uptick in the average percentage markdown, which reached 44%. The heightened discounting activity, coupled with a 1% decrease in average price2, likely led to a higher percentage of products selling out3, showing a 9% year-over-year increase. Additionally, the ratio of new to total products tracked4 decreased by 3% year-over-year, indicating that fashion retailers were more cautious with new product introductions likely in order to avoid an inventory surplus like last holiday season.
The Data Score: Which fashion retailers increased their promotional aggressiveness in January 2024 compared to January 2023, and which opted to maintain firmer prices with less promotion?
James Griffiths and Nick Katzaroff from Flywheel Digital: Yes, as evident from the chart above, 53% of retailers increased their promotional aggressiveness compared to last year, while 4% maintained the same level of aggressiveness. Meanwhile, the remaining 48% decreased their promotional aggressiveness. Notable US fashion retailers that significantly increased their promotion aggressiveness (by 4% year-over-year or more) include Levi’s, American Eagle, Michael Kors, Adidas, Saks Fifth Avenue, Target (Fashion), Neiman Marcus, H&M, Zara, Old Navy, Rent the Runway, and JCPenney. Conversely, Macy’s, Nike, Under Armour, Hanes, Patagonia, Skechers, Hollister, Aritzia, and Net-a-Porter all notably decreased their discounting activity (by 4% year-over-year or lower) in January 2024.
Concluding thoughts
Thanks again to James and Nick for sharing their time, effort, and data to check in on how the holiday selling season concluded. If you’d like to learn more, you can reach out to James and Nick by email at james.griffiths@flywheeldigital.com and nick.katzaroff@flywheeldigital.com
Also, feel free to leave comments and questions below the article too.
Feel free to share the article with anyone who would find it useful.
For more content like this and to see future interviews, subscribe to the Data Score Newsletter.
- Jason DeRise, CFA
Update On Feb 1, 2025: Premium content is now turned on. Even though this interview is in the premium content section of “Data Driven Investing,” I plan to keep interviews as free content.
Flywheel definition: Discounting activity = (% of products discounted) x (average % markdown).
Flywheel definition: Average price = Average USD price of all products regardless of discounting or in-stock status
Flywheel definition: Sell-through = % products sold out
Flywheel definition: New product ratio = % of total products tracked that were launched in the past 30 days


