
Satellite Data: 3 Good and 3 Bad Use Cases
“Alternative Data? Is that like satellites counting cars in parking lots?”

Inevitably, when people become aware of alternative data, the example of satellite-sourced data comes up.

Perhaps 1990s futuristic spy movies fueled imaginations with satellite images zooming into centimeters of resolution to reveal vital clues. Or there are delusions of grandeur that the eye(s) in the sky can see everything and therefore are all knowing. As an example, the 1998 film “Enemy of the State,” where the satellite zooms into the city, precisely finding the person walking through the intersection.
In reality, using satellite images for investment insights is constrained by significant limitations and caveats. However, satellites, remote sensing1, and computer vision2 offer highly valuable applications within the broader landscape of alternative data.
This article demystifies satellite imagery for investment use and explores three effective and three ineffective use cases. Satellite data excels at monitoring long-term trends (e.g., capex projects) but is less effective for fast-changing contexts like retail revenue estimation.
3 good use cases for remote sensing: Satellite data excels when tracking gradual, large-scale changes that don’t require constant updates.
Monitoring major capex projects
Oil extraction activity / flaring
Crop yields implications for agriculture commodities
3 bad use cases for remote sensing: Satellite data struggles in dynamic environments where frequent, precise measurements are critical.
Estimating retail revenues by counting cars in parking lots
Monitoring frequent changes in commodity inventory stockpiles
Real-time manufacturing activity
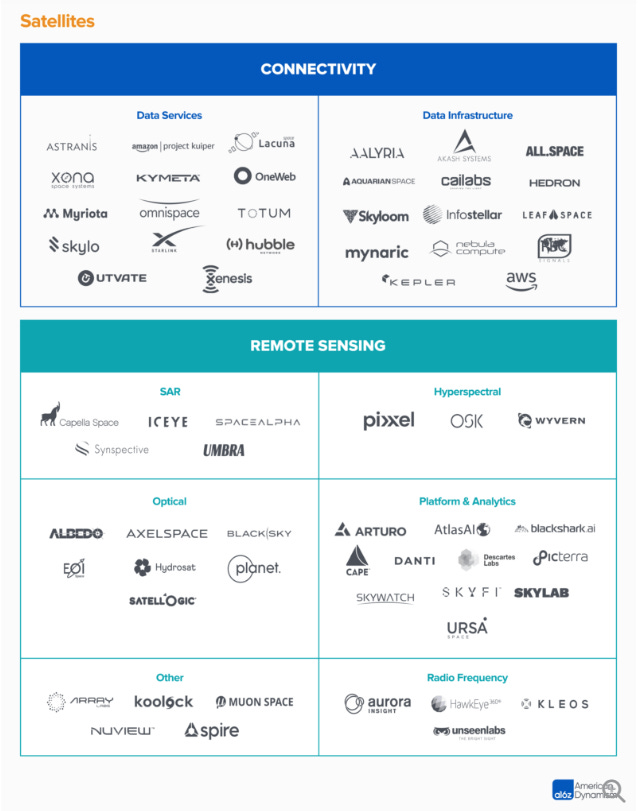
There are multiple sources of satellite images and data. Andreessen Horowitz provided this market map in 2023: https://a16z.com/space-a-market-map/
While we are talking about Market Maps, Dan Entrup’s It’s Pronounced Data on Beehiiv publishes an annual market map featuring data vendors across various types, often paired with satellite data. https://itspronounceddata.beehiiv.com/

Welcome to the Data Score newsletter, composed by DataChorus LLC. The newsletter is your source for insights into the world of data-driven decision-making. Whether you're an insight seeker, a unique data company, a software-as-a-service provider, or an investor, this newsletter is for you. I'm Jason DeRise, a seasoned expert in the field of data-driven insights. As one of the first 10 members of UBS Evidence Lab, I was at the forefront of pioneering new ways to generate actionable insights from alternative data. Before that, I successfully built a sell-side equity research franchise based on proprietary data and non-consensus insights. After moving on from UBS Evidence Lab, I’ve remained active in the intersection of data, technology, and financial insights. Through my extensive experience as a purchaser, user, and creator of data, I have gained a unique perspective, which I am sharing through the newsletter.
The Data Score is introducing premium content, which will be behind a paywall. Beginning February 1, 2025, Data Playbook, Data-Driven Investing, and Dataset Deep Dives will be premium content. These sections provide actionable strategies, in-depth case studies, and exclusive expertise tailored for data-driven professionals.
This article is in the Data-Driven Investing Section and will be moved behind the paywall on February 1, 2025.
The subscription will be priced at $9.99 per month or $99.99 annually.
Early subscribers can choose their own price (as low as the Substack minimum annual price) before February 1, 2025—an exclusive opportunity to lock in savings.
Basics of sourcing data via Satellites
Types of satellite orbits and types of sensors
Satellite data use depends on choosing the right orbit and sensor for the specific use case.